Blue-and-white concept image of tissue sections, cells and molecular structures; AI-generated illustration, not an analysis result

XUANHENG · RESEARCH DATA ANALYSIS

Sequencing & Omics Analysis

Explore cell composition and spatial microenvironments, connecting expression changes with genetic evidence.
From study design to figures, data and reports: results that can be reviewed.

AI-generated research concept image · Examples below use original report figures

ANALYSIS SERVICES

From cell composition to genetic evidence

Use existing data for focused or integrated analysis. Sequencing plans are assessed against sample conditions and research objectives.

Integrated evidence

Connect expression, cell, spatial and genetic data around a shared research question.

Study-specific design

Select methods for the samples, groups and available data, with an agreed analysis scope.

Reviewable results

Connect figures and result tables to method records, thresholds and interpretation limits.

Single-cell & single-nucleus transcriptomics

Cell composition and states

Resolve cell populations, subpopulations and states, and relate candidate expression changes to the relevant cell groups.

  • Cell and gene quality control, sample integration and clustering
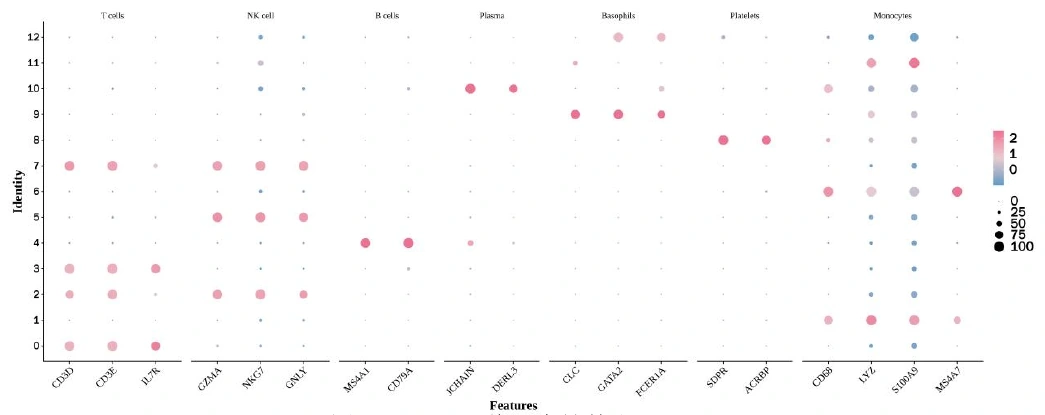
  • Marker genes, cell-type annotation and group comparisons
  • Functional scoring, communication inference and pseudotime analysis
Design & Requirements

Research questions

  • Which cell populations and subpopulations are present?
  • Which cell states change between conditions?
  • In which cells are the candidate genes expressed?

Deliverables

  • Quality-control summaries and cell annotations
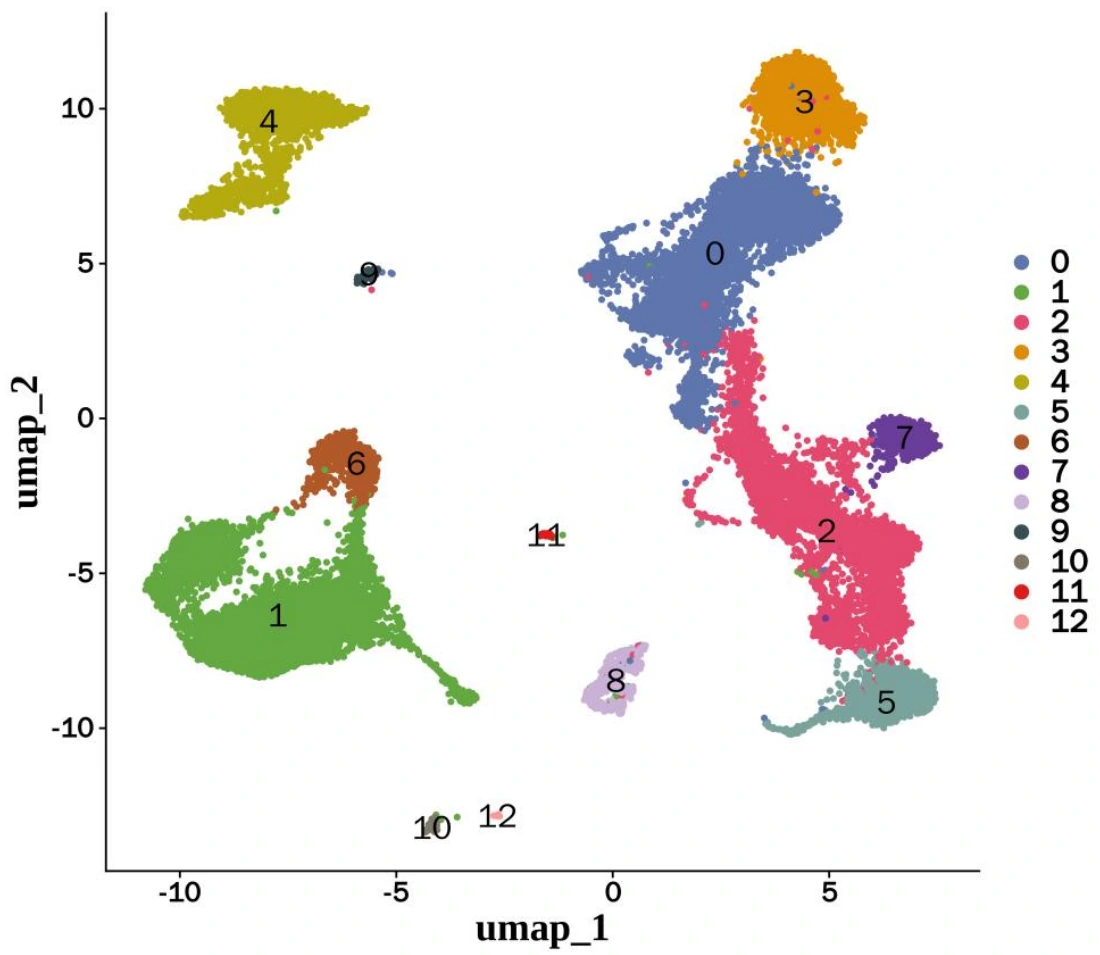
  • UMAP, marker-gene and expression figures
  • Differential expression, pathways and research-focused reports

Data preparation

Raw sequencing files or expression matrices, sample groups and experimental context. Sequencing plans are assessed against tissue type, sample quality and research objectives.

Methods & limitations

Methods may include Seurat, batch integration, AUCell and CellChat, depending on the data. Pseudotime orders relative expression states; it does not directly establish elapsed time or lineage.
Spatial transcriptomics

Expression in tissue context

Connect gene expression with tissue location to examine local cell composition and spatial microenvironments.

  • Quality control of tissue images and spatial expression data
  • Spatial domains, cell-composition inference and expression mapping
  • Microenvironments, functional enrichment and spatial associations
Design & Requirements

Research questions

  • Where in the tissue are candidate genes expressed?
  • How does cell composition vary across spatial regions?
  • Which pathways are associated with local microenvironments?

Deliverables

  • Tissue-location and expression-distribution figures
  • Spatial regions, cell-composition and pathway figures
  • Integrated reports and method records

Data preparation

Spatial expression data, tissue images and spatial coordinates. Integrated analysis also requires a compatible single-cell or single-nucleus reference.

Methods & limitations

Plans may involve data such as Visium, RCTD cell-composition inference, NMF microenvironment decomposition and functional enrichment. A spatial spot does not necessarily represent one cell; interpretation must account for platform resolution.

Bulk transcriptomics

Expression and functional changes

Compare expression between experimental groups and identify candidate genes and functional pathways for further investigation.

  • Sequencing quality control, alignment and expression quantification
  • Differential expression, clustering and functional enrichment
  • Candidate selection and cross-data checks
Design & Requirements

Research questions

  • Which expression changes occur between experimental conditions?
  • Which functions and pathways involve the differential genes?
  • Which candidate genes warrant further validation?

Deliverables

  • Expression matrices and differential-gene tables
  • Volcano plots, heatmaps and enrichment figures
  • Thresholds, methods and candidate-result notes

Data preparation

Sequencing files or expression matrices, species and reference version, sample groups and replicate information. Confounders and batch effects should be identified before analysis.

Methods & limitations

Expression quantification, differential analysis and GO, KEGG or GSEA interpretation follow the experimental design. Splicing, PPI and cross-omics integration depend on the available data and agreed research scope.

Genetic evidence & multi-omics integration

Candidate associations and evidence

Combine expression data with genetic summary statistics to assess candidate associations and agreement across omics evidence.

  • GWAS, eQTL, mQTL or pQTL data checks
  • SMR, HEIDI and colocalization analysis
  • Candidate selection and expression/function evidence integration
Design & Requirements

Research questions

  • Are genetic signals associated with candidate molecular traits?
  • Which findings agree or differ across omics layers?
  • Which associations warrant experimental validation?

Deliverables

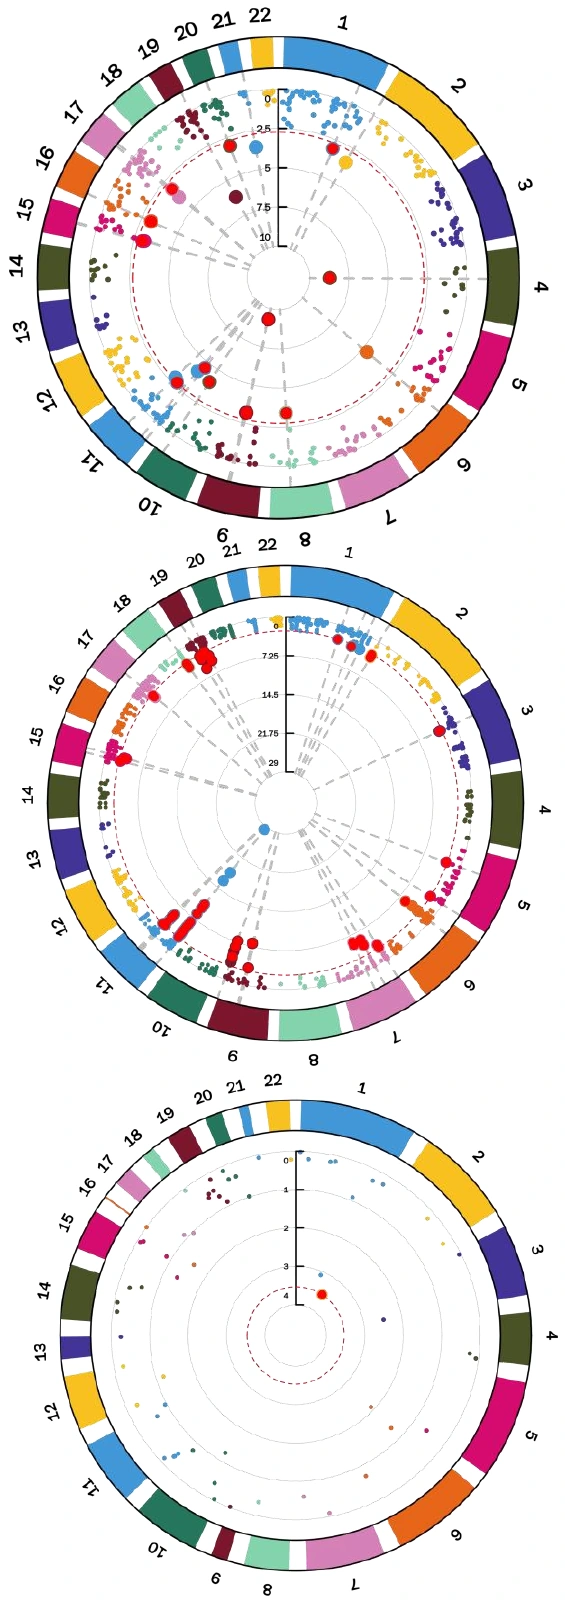
  • Genetic-association and regional figures
  • Candidate results, thresholds and evidence-summary tables
  • Data sources, limitations and research reports

Data preparation

GWAS and QTL summary statistics, reference genome and population information. Sample sources, variant coverage and tissue relevance require assessment.

Methods & limitations

SMR and colocalization assess statistical evidence. Results depend on variant coverage, LD reference, study population and analytical assumptions; they do not alone establish a causal mechanism or clinical diagnostic value.

RESEARCH EXAMPLES

Research questions, evidence and results

Three research examples with integrated analysis paths and original report figures.

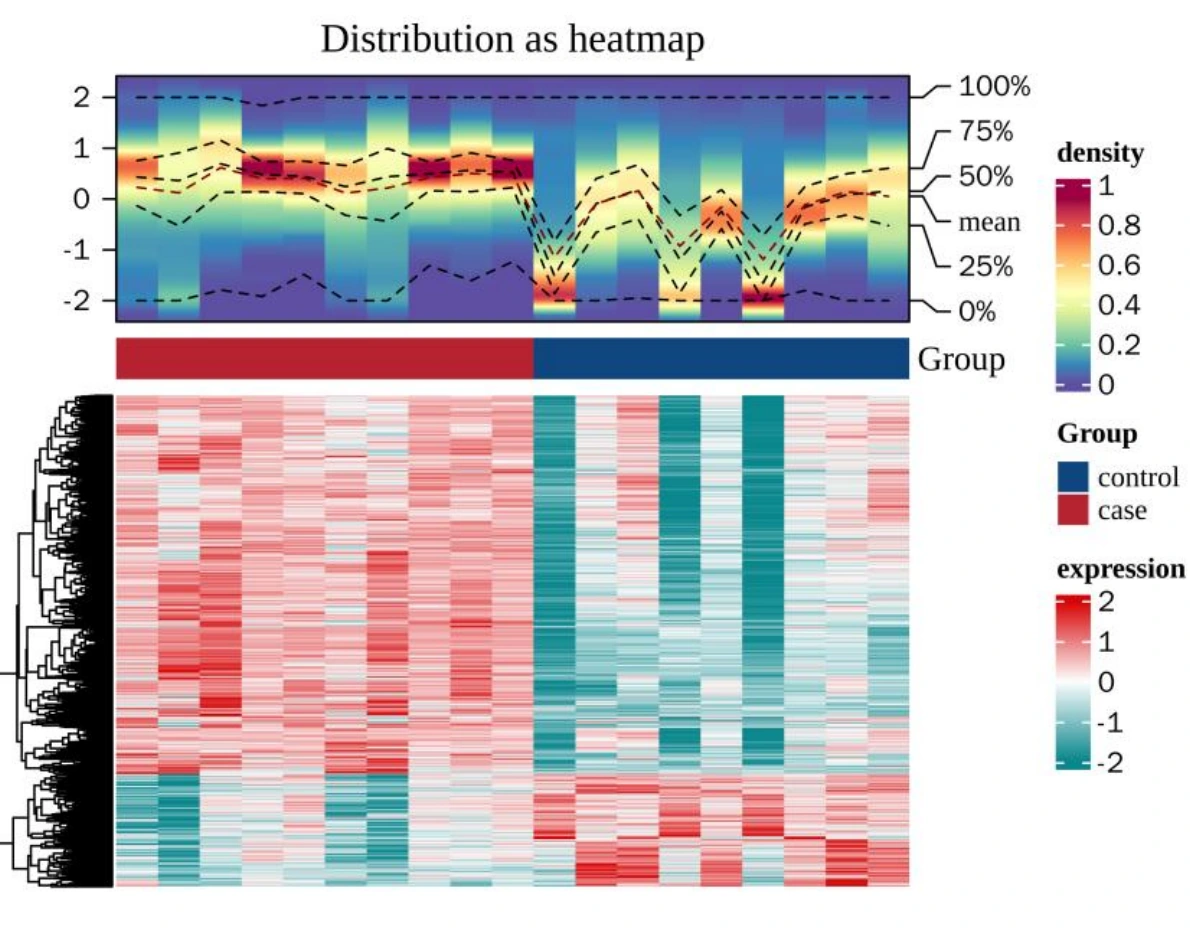
Bulk transcriptomics + single-cell analysis

Expression and single-cell research in diabetic retinopathy

Connect bulk expression changes with a cell atlas to examine the cellular context of phospholipid-metabolism candidate genes.

Analysis path
Differential expression → candidate genes → cell annotation → functional and communication inference
Interpretation limits
Clusters and cell types are not equivalent. Candidate genes and inferred communication relationships require independent validation.

Source: Transcriptomics and single-cell research report · Figures 2, 33 and 34

More Figures & Study Context
Research question

Which cell populations and functional findings correspond to candidate expression changes in bulk samples?

Results scope

Differential expression, cell atlas, marker genes, candidate expression and functional analysis.

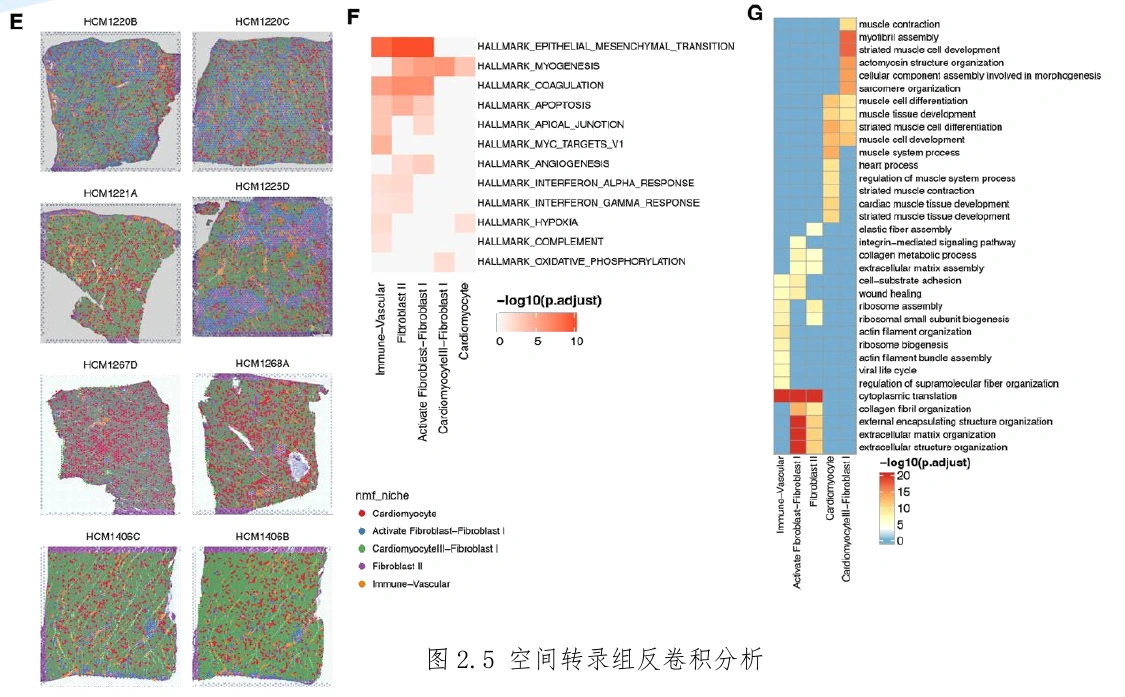
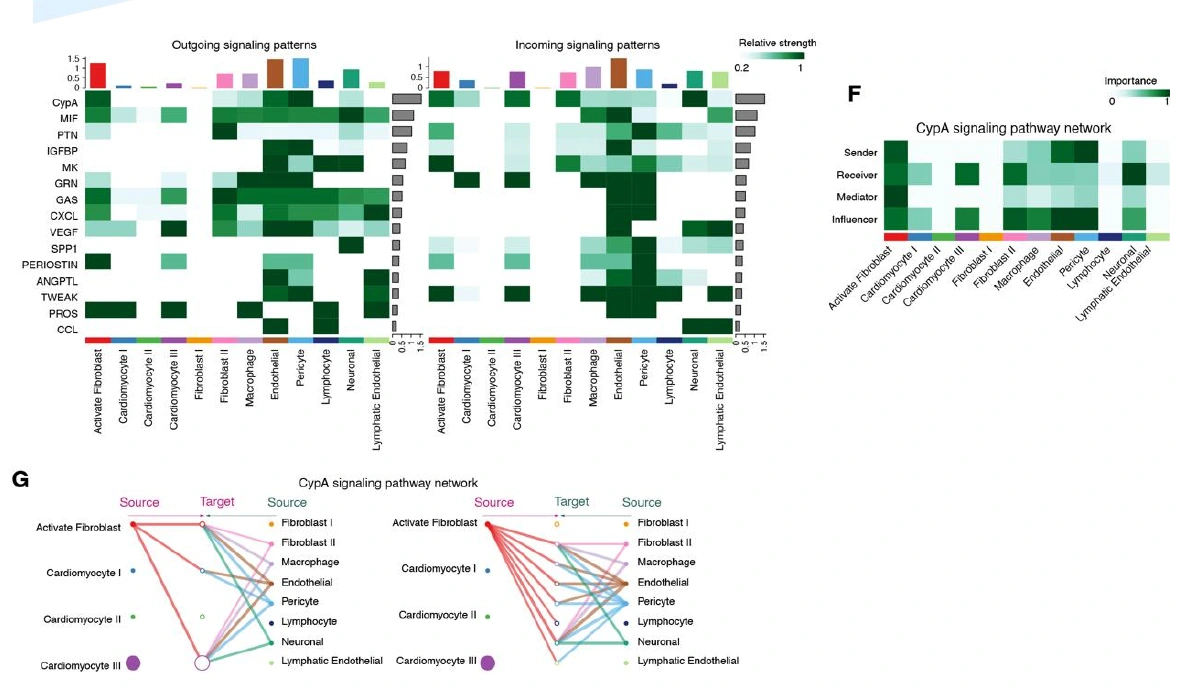
Single-nucleus + spatial transcriptomics

Cellular and spatial microenvironments in cardiac tissue

An example combining single-nucleus and spatial data to examine tissue microenvironments in hypertrophic cardiomyopathy (HCM).

Analysis path
Cell annotation → spatial composition inference → microenvironment decomposition → functional and communication patterns
Interpretation limits
The report contains no normal-control spatial samples. Spatial patterns are not presented as established differences between normal and diseased tissue.

Source: Spatial transcriptomics research report · Figures 2.5 E–G and 2.7 E–G

More Figures & Study Context
Research question

How are cell states, tissue locations and local functional patterns associated?

Results scope

Spatial microenvironment, functional-enrichment and candidate-signaling figures.

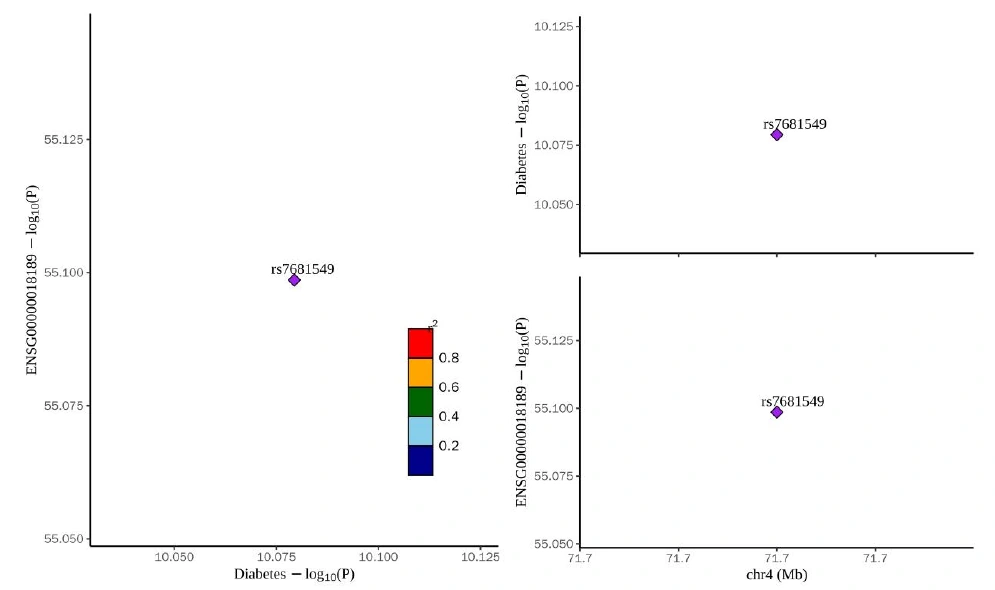
Expression data + GWAS + QTL

Integrating genetic evidence and expression in type 2 diabetes

Combine expression findings with genetic summary statistics to assess candidate associations related to mitophagy.

Analysis path
Candidate selection → QTL/GWAS checks → SMR/HEIDI → colocalization and functional integration
Interpretation limits
Colocalization interpretation depends on variant coverage and data conditions. Findings are not presented as strong causal evidence or diagnostic accuracy.

Source: SMR research report · Figures 6 and 7

More Figures & Study Context
Research question

Can genetic associations and expression findings jointly support candidate molecular traits for further investigation?

Results scope

SMR associations, regional figures and candidate-evidence summaries.

PROCESS & DELIVERY

From research question to delivery

Analysis scope, file formats and review requirements are agreed during study planning.

  1. Research consultation

    Confirm samples, groups, data and objectives, and agree on the analysis scope.

  2. Data assessment

    Review quality, batches and replicates, and clarify the usable data scope.

  3. Analysis & interpretation

    Perform focused or integrated analysis, checking key results and method assumptions.

  4. Results delivery

    Deliver figures, result tables and reports with methods and key thresholds.

Research Figures

Cell, expression, spatial and genetic figures with legends and labels.

Analysis Data

Expression, annotation, differential, enrichment and candidate-result tables.

Research Reports

Data sources, analysis methods, key thresholds and result interpretation.

PLANNING YOUR STUDY

Before you begin

Can you analyse existing sequencing data?

Yes. Share the data type, sample groups and research objectives. We assess quality and usable scope before agreeing on the analysis plan.

How do I choose single-cell, single-nucleus or spatial analysis?

Single-cell and single-nucleus analysis focus on cell composition and states; spatial analysis retains tissue location. Choose according to tissue properties, sample conditions and research objectives, without forcing integration of incompatible datasets.

CONNECT WITH XUANHENG

Start with your samples and research question

Share your data type, sample groups and analysis objectives to discuss a suitable study plan.

Discuss Your Study

These examples do not guarantee the same findings in other projects. Communication, pseudotime, spatial composition and genetic associations are computational inferences requiring independent review. Services are for research and do not replace experimental validation or clinical diagnosis.

Analysis image preview

100%

Contact on WeChat